Creating Custom Charts
Categories:
Originally by Nikola Kukrika at Microsoft Development Center Copenhagen
Abstract
The goal of this solution is to enable you to:
- Use charts in the web client.
- Create charts with custom functionality.
Description
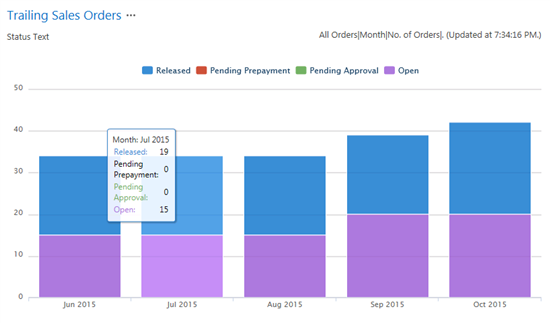
This pattern enables you to implement a business chart (Specific Chart type) in a way that is maintainable and reusable on other pages. This also enables you to provide specific functionality that is not possible with the Generic Chart type and it enables you to show charts in the web client.
The Business Chart add-in is a special because it is a combination of .NET and Javascript add-ins depending on the display target. In the web client, it renders a JavaScript control, while in the win client, it renders a .Net control. Because of this behavior, you can expect minor differences in how the chart is presented in the win client versus in the web client. Note that this implementation is specific to NAV platform code, because it is not possible to create add-ins that combines .NET and JavaScript by using a framework API.
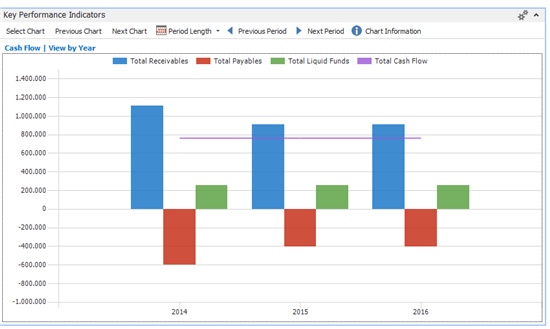
Example of the same chart in the win client:
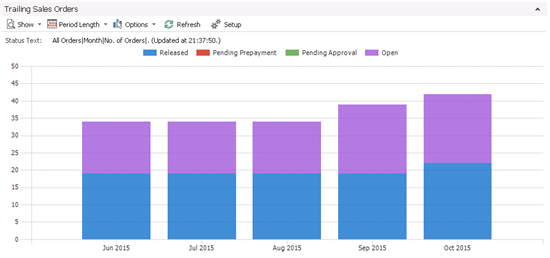
The most obvious differences in chart rendering in the two clients are: Slightly different line heights, slightly different chart height, legends in web-client charts can be used as toggle filters to show/hide groups (this is not possible in the win client).
Implementation Overview
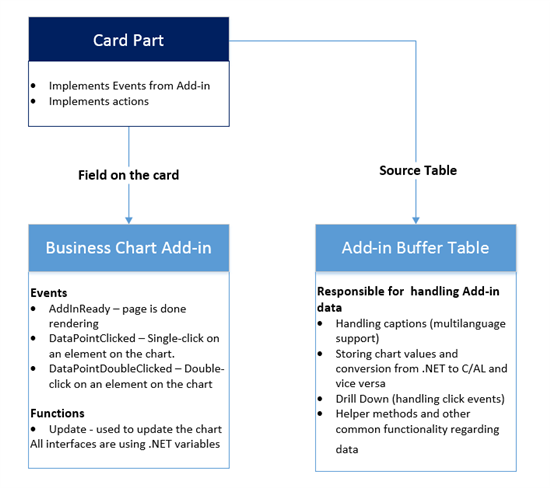
Add-in Buffer Table
This table is used to encapsulate the logic of the Business Chart Add-in. The table handles the following logic:
- Storing chart values and conversion from .NET to C/AL and vice versa
- Handling of captions: We must use C/AL to provide multilanguage text in add-ins. In addition, the multilanguage text must be encapsulated in a single place, because we pass/read the same dataset from/to the add-in.
- DrillDown logic
- Other helper data related functions, for displaying date, periods, etc.[Bogdana1] [NK2] [NK3]
Note: It is recommended that you reuse the Business Chart Buffer table (485) as a buffer table or extend. It is a generic table which should cover most of the use cases. Implement a new buffer table only if this table does not meet your needs.
CardPart page
The CardPart page hosts the Business Chart add-in and must use the add-in buffer table as a source table.
On the page, you must implement the following triggers:
- AddInReady – Executed when the page is done rendering. Used to initialize the add-in.
- DataPointClicked – Single-click on an element on the chart.
- DataPointDoubleClicked – Double-click on an element on the chart
The CardPart usually contains a StatusText variable to provide more information about the chart or dataset and a set of actions to control the chart.
The most commonly used actions are:
- Select Chart, Previous Chart, Next Chart
- Set Period, Work Date
- Actions to filter the data set
- Refresh
- Chart Information – a tooltip with a description of the chart and how data is calculated.
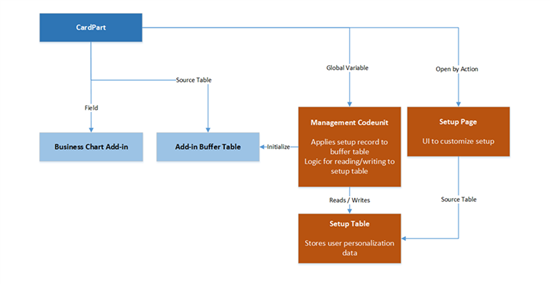
Optional: Preserving User Personalization
One of the most common functionalities is personalization. If the chart can be customized by the user, you should store the settings that the user has entered and apply them the next time the chart is loaded.
To do this, you need the following:
- A setup record to store the data. You can use the Business Chart User Setup table (487) or create a new setup table if you need to store more information.
- A management codeunit to write/apply the settings to the chart and to encapsulate other logic. Since we should not write code on pages, the code for the actions and other logic that does not apply to the setup record should go in this codeunit.
- Setup pages where users can customize how the chart is shown and set different settings.
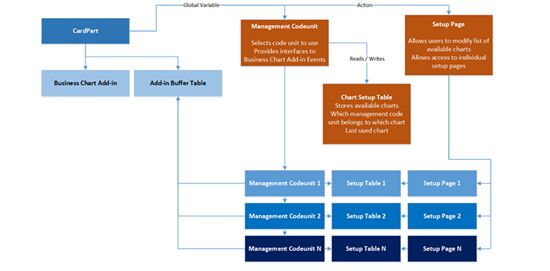
The relation between the components is visualized in the following diagram:
Optional: Show Multiple Charts within a Single CardPart
This option is useful on a Role Center where you want to show multiple charts using different datasets within a single part. In that case, you need a record to store the last chart selection, the setup records, and code units for separate charts.
See, for example, the implementation of the Mini Generic Chart page (1390), which uses MiniChartManagment CodeUnit to manage separate management codeunits for charts and their setup records. The last selected chart is stored in a separate table, Mini Chart Definition (1310).
Usage
To implement the pattern, create a new ChartPart and set the source table to Business Chart Buffer.
Add a field named BusinessChart and set the ControlAddIn property to Microsoft.Dynamics.Nav.Client.BusinessChart.
Then implement the AddInReady event. This event is executed when the page is done rendering. Code within this method must call the Update method from the Business Chart Buffer table, Update(CurrPage.BusinessChart) to initialize the chart and assign initial values.
If you need a setup record and codeunit, then it is a good idea to encapsulate this logic within a method.
NAV Specific Example 1
Implementation of the Finance Performance Chart page (762)
BusinessChart::AddInReady()

UpdateChart(Period::" ");

LOCAL UpdateChart(Period : ',Next,Previous')

MoveAndUpdateChart(Period,0);

LOCAL MoveAndUpdateChart(Period : ',Next,Previous';Move : Integer)

AccSchedChartManagement.GetSetupRecordset(AccountSchedulesChartSetup,AccountSchedulesChartSetup.Name,Move);

AccSchedChartManagement.UpdateData(Rec,Period,AccountSchedulesChartSetup);

Update(CurrPage.BusinessChart);

StatusText := GetCurrentSelectionText("Period Filter Start Date","Period Filter End Date");
In the MoveAndUpdateChart method, the AccSchedChartManagement codeunit gets a setup record and updates it if necessary. Then, it initializes the chart with setup data and sets the StatusText to show the period for which data is displayed. The same method is used by the actions to move and update the chart so that there is no code duplication.
The following code is used to implement DataPointClicked
BusinessChart::DataPointClicked(point : DotNet "Microsoft.Dynamics.Nav.Client.BusinessChart.BusinessChartDataPoint")

SetDrillDownIndexes(point);

AccSchedChartManagement.DrillDown(Rec,AccountSchedulesChartSetup);
SetDrillDownindexes is a method from the Business Chart Buffer table that maps the DotNet point variable to C/AL data, so it must be used. The next method that you must implement is the action to be performed on Drilldown.
The DataPointDoubleClicked trigger has the same implementation logic as the DataPointClicked trigger.
NAV Specific Example 2
Implementation of chart part 1390 on the Small Business Role Center page (9022)
This chart part contains data from multiple charts within a single part. The Status Text field shows the name of the chart and the current period. Users can browse through the charts with Next Chart and Previous Chart or use Select Chart to choose from a list of available charts.
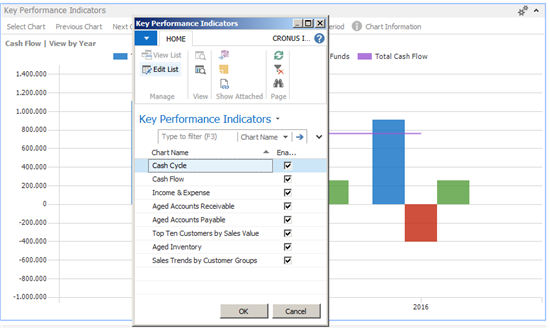
On this dialog, users can choose if a chart should be enabled or disabled. If the chart is not enabled, it will be skipped on the Previous Chart and Next Chart actions. Charts used by this part use different codeunits and setup records. If the user changes the selected chart, this option will be saved and applied next time role center is opened.
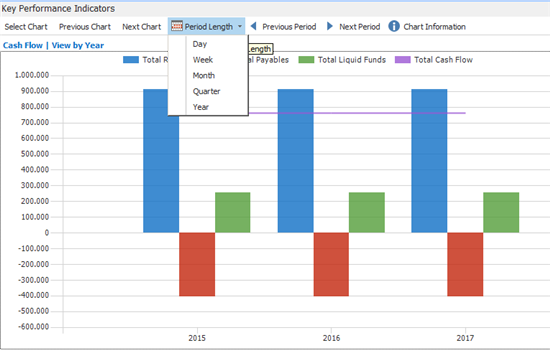
Users can also change the period length.
Choosing the Chart Information button opens a short description of the chart.
NAV Usages
Implementation of multiple charts within a single part:
- Page 1390, Mini Generic Chart
Charts that use a setup record and select the chart with Customize Chart Setup pages:
- Page 772, Inventory Performance
- Page 771, Purchase Performance
- Page 770, Sales Performance
- Page 762, Finance Performance
Chart that uses the Business Chart User Setup table:
- Page 768, Aged Acc. Receivable Chart
Other implementations:
- Page 972, Time Sheet Chart
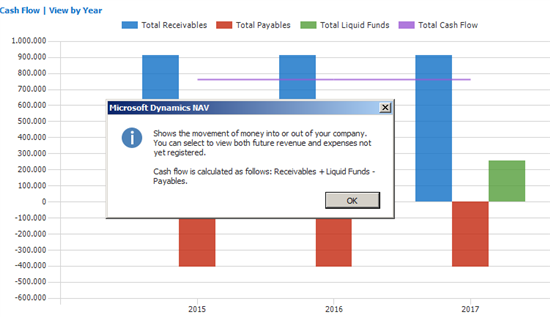
- Page 869, Cash Flow Chart
- Page 760, Trailing Sales Orders Chart
Ideas for improvement
We should consider making a generic table for the last chart that the user has used.
We should investigate if we could make generic code for selecting periods and other common functionality by using RecordRefs.
Add-In improvements – Different ways to visualize the data and to pick colors for categories.
As a nice-to-have feature, we could implement functionality to cycle through the charts with a timer.